Lot No. LOT-7810 · offered November 11, 2026
Seeds, Crop Protection & FertilizerLot sheet
University of Wisconsin raises P and K soil test ranges in updated A2809 guidelines
UW-Madison Extension raised P and K soil test ranges for corn and soybeans in the updated A2809 guidelines, drawing on 20 years of Wisconsin soil and yield data.
Market notes
- UW Publication A2809 corn and soybean nutrient guidelines updated November 11, 2026, using 20 years of Wisconsin data.
- K ranges increased significantly for loamy soils; P ranges rose slightly in both soil types; sandy-soil K unchanged.
- Corn removes roughly 0.38 lb P2O5 and 0.2 lb K2O per bushel; soybeans remove 0.8 lb P2O5 and 1.26 lb K2O per bushel.
- New ranges apply to Demand Level 1 crops only; alfalfa, wheat and corn silage guidance is not yet published.
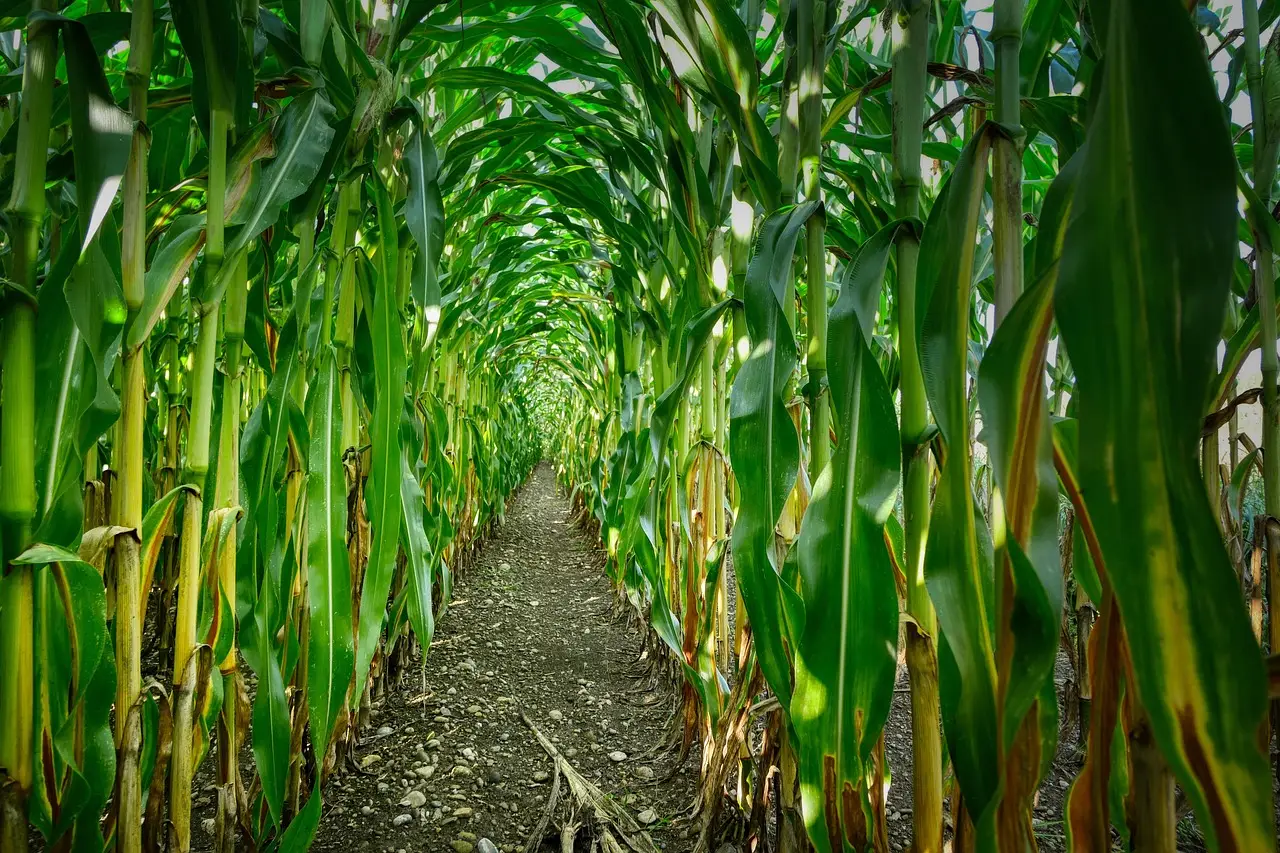
Corn and soybean growers in Wisconsin now work with higher soil test benchmarks for phosphorus and potassium, after the University of Wisconsin updated Publication A2809 — the Nutrient Application Guidelines for Field, Vegetable, and Fruit Crops in Wisconsin — for the first time in several years, using soil sample and crop yield data collected across the state over the past 20 years.
The revision, published November 11, 2026, by UW-Madison Extension, matters for fertilizer budgets. Too much nutrients means wasted input spend and environmental risk. Too little means lost yield and income. The guidelines sit at the center of that calculation for most Wisconsin producers.
What changed in the new ranges?
Soil test category ranges for P and K come from the correlation between soil test values and relative yield. Compared with the previous edition, the new values:
- increased slightly for phosphorus in both soil types;
- increased significantly for potassium in loamy soils;
- held steady for potassium in sandy soils.
The published values cover Demand Level 1 crops only: corn grain, soybeans, small grains other than wheat, and pasture. Higher-demand crops — alfalfa, wheat, corn silage and vegetables — fall under demand levels UW has not yet published. Extension says updates for those crops will follow as researchers evaluate more data.
Why the categories drive fertilizer spend
The ranges aren't labels for their own sake. They set the probability that a crop responds to added nutrients, and that probability sets the rate.
If a soil tests low, there's a high probability the crop responds positively to additional nutrients. If it tests high, that probability drops sharply — and applying more isn't profitable. It also raises risks to groundwater and surface water quality, a cost that extends past the farm gate.
Extension crops and soils educator Jordyn Sattler, who wrote the guidance, frames the target plainly: maintain soils in the optimum category. At optimum, the soil already supplies enough nutrients, and the grower only replaces what the harvest removes.
The crop-removal math
Crop removal — the nutrients that leave the field in the harvested crop — anchors every rate recommendation. The removal coefficients are concrete:
- Corn: roughly 0.38 pound of P2O5 and 0.2 pound of K2O per bushel.
- Soybeans: roughly 0.8 pound of P2O5 and 1.26 pounds of K2O per bushel.
Multiply those numbers by yield in bushels per acre, and you have the replacement requirement for a soil already in the optimum range.
Test categories then adjust that baseline. Soils testing low or very low need fertilizer above crop removal to build nutrient levels over time. Soils testing high — or very high, a category used only for potassium — can take just a portion of the removal rate, because the soil already supplies more than enough and should be drawn down slowly toward optimum. Soils testing excessively high for P or K get no phosphorus or potassium fertilizer recommendation at all.
What does this change for a grower's spring fertilizer order? Potentially the rate itself. Where loamy-soil K thresholds moved up meaningfully, fields that previously fell into the high category — and earned a reduced rate — may now sit closer to optimum, qualifying for fuller replacement rates.
Practical next steps
The guidelines include equations for calculating corn and soybean application rates directly, plus quick reference charts in each crop section on the Nutrient Application Guidelines for Wisconsin website. Routine soil sampling remains the entry point: without current test values, the new ranges don't tell a producer anything actionable.
UW says it will continue updating guidelines for other crops as more research comes in. Growers with field-specific questions can contact their local Extension crops and soils educator.
via Farm Progress (Source)
More from Nathan Brooks
Show full bio
Staff writer covering regulation, policy and their impact on Agribusiness coverage for industry professionals at Agribusiness Wire.
546 articles
Also in the yard
- Guessing on Fertilizer Rates Costs Real Money, Soil Tests Show
- Wisconsin Corn Harvest Matches Average, Soybeans Trail by Five Points
- Retail Fertilizer Prices Came in Lower, WEAU's AG Chat Reports
- High Fertilizer Prices Pressure 2027 Corn Acreage, UkrAgroConsult Warns
- Fine-Tuned Fertilizer Use Offers Corn Growers a Path to Lower Input Bills