Lot No. LOT-8633 · offered September 29, 2026
Commodity MarketsLot sheet
September WASDE to Test USDA's 180.7 bpa Corn Yield
USDA's 180.7 bpa corn yield meets field data Sept. 11 as crop ratings lag last year; export pace and WASDE history point to harvest-season price risk.
Market notes
- USDA projects a 180.7 bpa national corn yield; Pro Farmer's crop tour estimated 173.2 bpa.
- Only 57% of U.S. corn rated good or excellent as of Aug. 30, versus 69% a year earlier.
- 2000-2023 data shows average absolute September WASDE-day moves of about 8 cents for corn and 17 cents for soybeans.
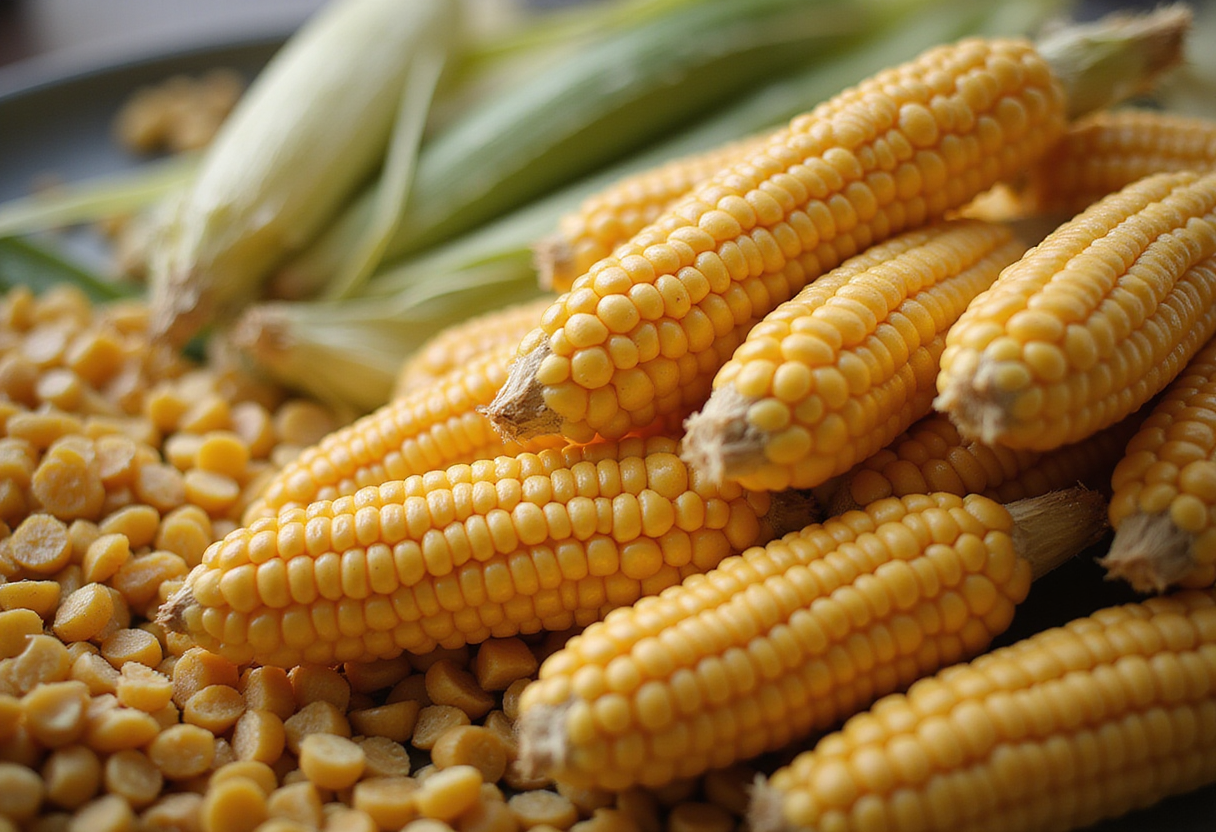
The USDA will release its September World Agricultural Supply and Demand Estimates on Friday, Sept. 11, and the agency's national corn yield projection of 180.7 bushels per acre faces its first serious challenge from objective field data. Pro Farmer's August crop tour estimated yield at 173.2 bushels per acre — a gap of 7.5 bushels that markets will ask USDA to reconcile when National Agricultural Statistics Service surveyors incorporate plant populations and ear counts from the 10 largest corn-producing states.
Crop condition data already points downward. Only 57% of U.S. corn rated good or excellent as of Aug. 30, compared with 69% a year earlier. Soybeans tell a similar agronomic story: 58% good-to-excellent, down from 65% last year, though USDA's 52.7 bushel-per-acre soybean yield estimate actually sits below the crop tour's 53.3 figure.
Unlike summer projections built heavily on statistical models, the September report folds in field measurements and accounts for regional weather differences and late-season development. That makes it a critical checkpoint between model-based expectations and what combines actually find across the Corn Belt.
Export pace splits old crop from new
Corn demand presents competing signals. Old-crop export inspections had reached 97% of USDA's August export estimate, ahead of the five-year average pace of 93% at the comparable point — strength that makes a significant build in old-crop ending stocks unlikely. New-crop commitments run the other way: 2026/27 sales represent about 15% of USDA's forecast against a five-year average of 21%.
The August WASDE had already trimmed old-crop corn carryout by 75 million bushels and cut new-crop ending stocks by 137 million bushels. Another yield reduction without an offsetting demand adjustment would tighten the balance sheet further and could support prices. The market reaction will hinge on harvested acreage, exports, feed use and ethanol demand — not yield alone.
Soybean demand offers more constructive footing. Old-crop export inspections run roughly 3 percentage points ahead of the five-year pace needed to meet USDA's August projection. New-crop export commitments stand at 32% of USDA's forecast, well above the five-year average of 23%. July crush reached 222 million bushels, up from 218 million in June and 205 million a year earlier. Strong crush and export commitments limit USDA's room for bearish demand revisions even if production edges higher.
Wheat carries the weakest demand picture. Sales for the 2026/27 marketing year have reached about 39% of USDA's August projection, trailing the five-year average of 42%. Export inspections run at 21% of the forecast versus a historical pace near 19%. If sales fail to accelerate, USDA could eventually trim its export outlook, adding supply to ending stocks and capping price support for wheat growers.
History flags harvest-season price risk
Market research covering 2000-2023 found an average absolute September WASDE-day move of roughly 8 cents for corn and 17 cents for soybeans. Corn posted a negative reaction in 59% of those observations; soybeans declined 55% of the time. Wheat also reacted negatively in 59% of years studied, though with smaller swings. The pattern is a risk measure, not a forecast.
For producers weighing storage, forward contracting and hedging, the stakes run through the whole margin picture. A lower corn yield combined with firm exports could tighten projected stocks and lift the price outlook; a stronger-than-expected soybean yield could produce the opposite reaction. Commodity prices feed directly into cash flow, crop insurance calculations, co-op activity, farmland economics and purchases of fertilizer, seed and machinery — decisions producers must make while input costs stay elevated.
The Sept. 11 report will not settle every question about the 2026 crop. But analysts and growers will read corn and soybean yields, ending stocks and export forecasts together rather than anchoring on a single headline number. With margins compressed, shifts of a few bushels per acre or several million bushels of demand could materially reshape marketing windows before the October estimates deliver the next official production read.
via localhost (Original)
More from Marcus Bennett
Show full bio
Senior reporter covering marketplaces and e-commerce at Agribusiness Wire.
127 articles
Also in the yard
- Soybean Harvest at 17%, Below Every Trade Estimate, USDA Says
- USDA: Corn Harvest Hits 18%, Matching Five-Year Average Pace
- Wisconsin Corn Harvest Matches Average, Soybeans Trail by Five Points
- August WASDE Report Pushes U.S. Grain Prices Higher
- Corn Slips to $5.22 as Traders Position Ahead of USDA Stocks Report