Lot No. LOT-3586 · offered November 7, 2026
Crop EconomicsLot sheet
Corn, soybean harvest prices lift revenue protection guarantees
October futures averages lifted corn and soybean revenue-protection guarantees above spring levels for the first time in four and five years, adding about $22 and $80 per acre.
Market notes
- December corn futures averaged $4.75 in October 2026, 13 cents above February’s $4.62 spring price.
- November soybeans averaged $12.63, $1.54 above the $11.09 spring guarantee.
- At 85% coverage, 200-bushel corn APH gained about $22 per acre; 60-bushel soybean APH gained nearly $80.
- Corn harvest prices last exceeded spring prices in 2022; soybeans did so in 2021.
- The 2012 historic highs were $7.50 for corn and $15.39 for soybeans.
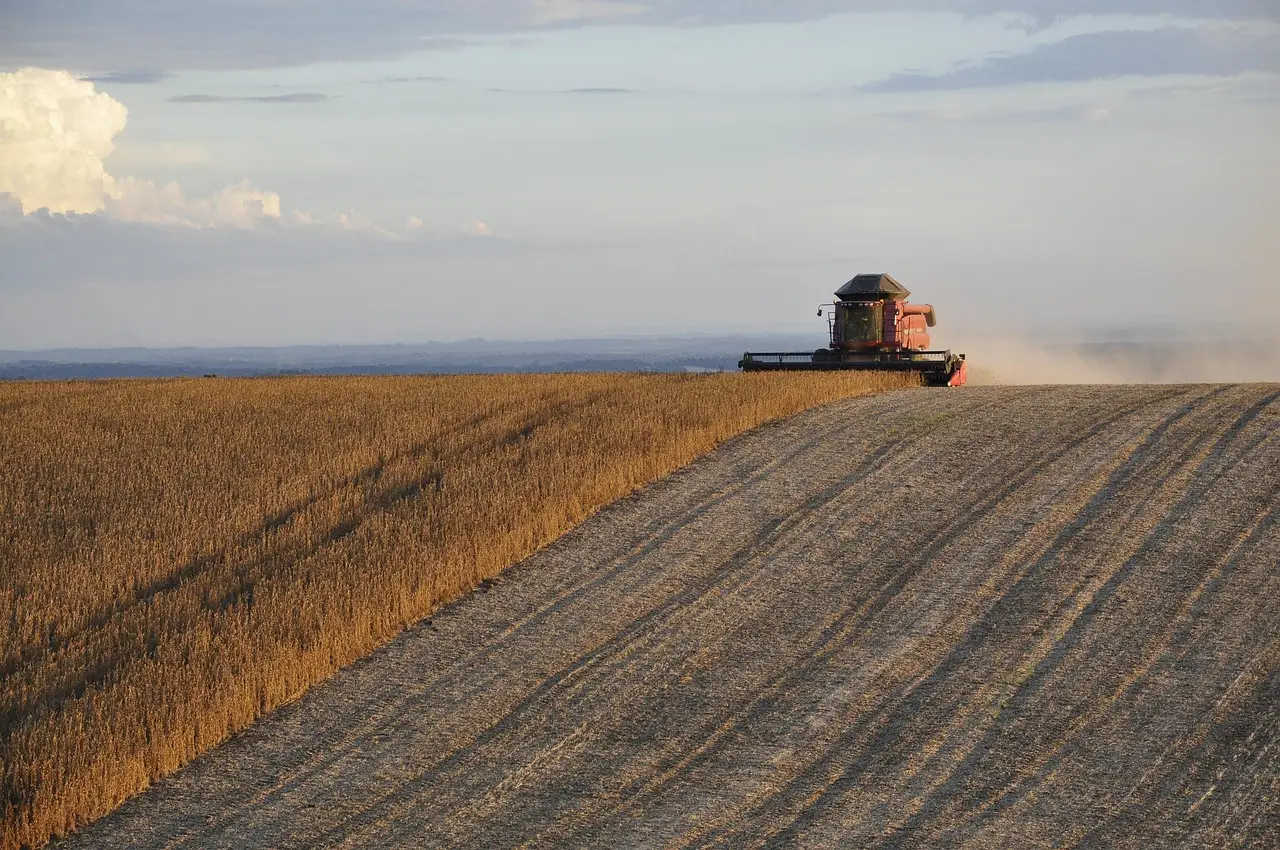
December corn futures averaged $4.75 a bushel in October 2026, 13 cents above the $4.62 spring projected price established in February.
As of November 5, 2026, the October crop price discovery window—the period the U.S. Department of Agriculture’s Risk Management Agency (RMA) uses to set harvest-price values for revenue protection—has closed. The November soybean contract averaged $12.63 during October, $1.54 above the $11.09 spring guarantee.
For corn, that is the first harvest-price result above the spring projected price in four years; for soybeans, the first in five years. Corn growers last saw the favorable comparison in 2022, while soybean growers last saw it in 2021.
What does the price increase change for insured growers?
Revenue protection establishes a guaranteed revenue amount from a producer’s approved actual production history (APH), the applicable projected or harvest price, and the selected coverage percentage. The harvest-price option allows a higher October price to improve the guarantee.
At 85% coverage, a corn producer with 200 bushels of APH will see the revenue guarantee rise about $22 per acre. A soybean producer with 60 bushels of APH at the same coverage level gains nearly $80 per acre in protection.
Those examples illustrate the policy calculation, not a uniform farm-level result. The source provides contract-price averages for the stated periods rather than survey data from growers, and it reports guarantee levels rather than cash payments to producers.
Which other crops can use the harvest-price option?
The harvest-price feature also extends to:
- Barley
- Canola
- Cotton
- Grain sorghum
- Rice
- Sunflowers
- Wheat
RMA derives grain sorghum’s harvest price from the December corn contract. The $4.75 corn average therefore strengthens sorghum’s harvest-price reference as well, although the source provides no separate sorghum figure.
Availability of the option does not mean October prices exceeded spring levels for every listed crop. The source supplies no comparative figures for barley, canola, cotton, rice, sunflowers or wheat, so the direction of their harvest-to-spring relationships remains unsubstantiated.
How do the 2026 prices compare with recent history?
The favorable corn comparison follows three consecutive years in which the harvest price did not exceed the spring projected price. For soybeans, the October result ends a four-year stretch without an above-spring harvest price.
The historic highs remain the drought-driven 2012 prices of $7.50 for corn and $15.39 for soybeans. Both 2026 contract averages remain below those levels, despite their improvement over the spring references.
What does this mean for input costs and farm margins?
The October figures are insurance price-discovery inputs, not harvested results. The source reports no yield, crop-condition, local cash-price or final-margin data. Farmers must also separate the futures-based insurance calculation from local basis, the difference between a local cash price and the relevant futures price.
The higher guaranteed revenue gives covered growers more protection at the same production history and coverage level. It can cushion unfavorable output prices and input-cost pressure, but the source quantifies neither farm expenses nor a change in operating margin.
Realized margins will depend on final yields, local basis, harvest expenses and input prices, none of which the October contract averages capture. A grower with lower APH or a different coverage percentage may not receive the same per-acre increase shown in the examples. The next test for growers is whether final yields, basis and input costs leave room above the newly higher insurance floor.
via Farm Progress (Source)
More from Rebecca Stone
Show full bio
Market editor covering people, launches and day-to-day practice in Agribusiness coverage for industry professionals at Agribusiness Wire.
465 articles
Also in the yard
- Soybeans fall below $12 as USDA crop, export tests loom
- USDA Yield Test Meets Returning Chinese Soybean Demand
- Grain Rally Lifts U.S. Farm Outlook, But Input Costs Keep Squeeze On
- Corn Clears $5 at Three-Year Highs as Grains Extend Summer Rally
- USDA Raises Corn Carryout to 1.849 Billion Bushels, Up 282 Million