Lot No. LOT-2989 · offered October 15, 2026
Commodity MarketsLot sheet
Soybeans Top Cash Bids in USDA's Week 40 of 2026 — IndexBox
USDA cash-price data summarized by IndexBox shows soybeans at the top of cash-bid rankings in Week 40 of 2026, the early-October window that coincides with the start of Corn Belt harvest. IndexBox did not disclose dollar-per-bushel figures or the elevator count behind the top pla
Market notes
- USDA data summarized by IndexBox placed soybeans at the top of cash-bid rankings in Week 40 of 2026, the first week of October.
- Week 40 overlaps with the early stages of Corn Belt harvest pressure, when new-crop supply typically weighs on elevator bids.
- The IndexBox summary did not release specific dollar-per-bushel figures, the number of reporting elevators, or the geographic spread of the top-of-table pricing.
- USDA's Agricultural Marketing Service publishes the underlying elevator-by-elevator cash-grain data that feeds the cash-bid rankings.
- Week 41 cash-bid data, expected mid-October 2026 alongside USDA NASS harvest progress figures, will determine whether the soybean-premium finding is a one-week reading or a sustained trend.
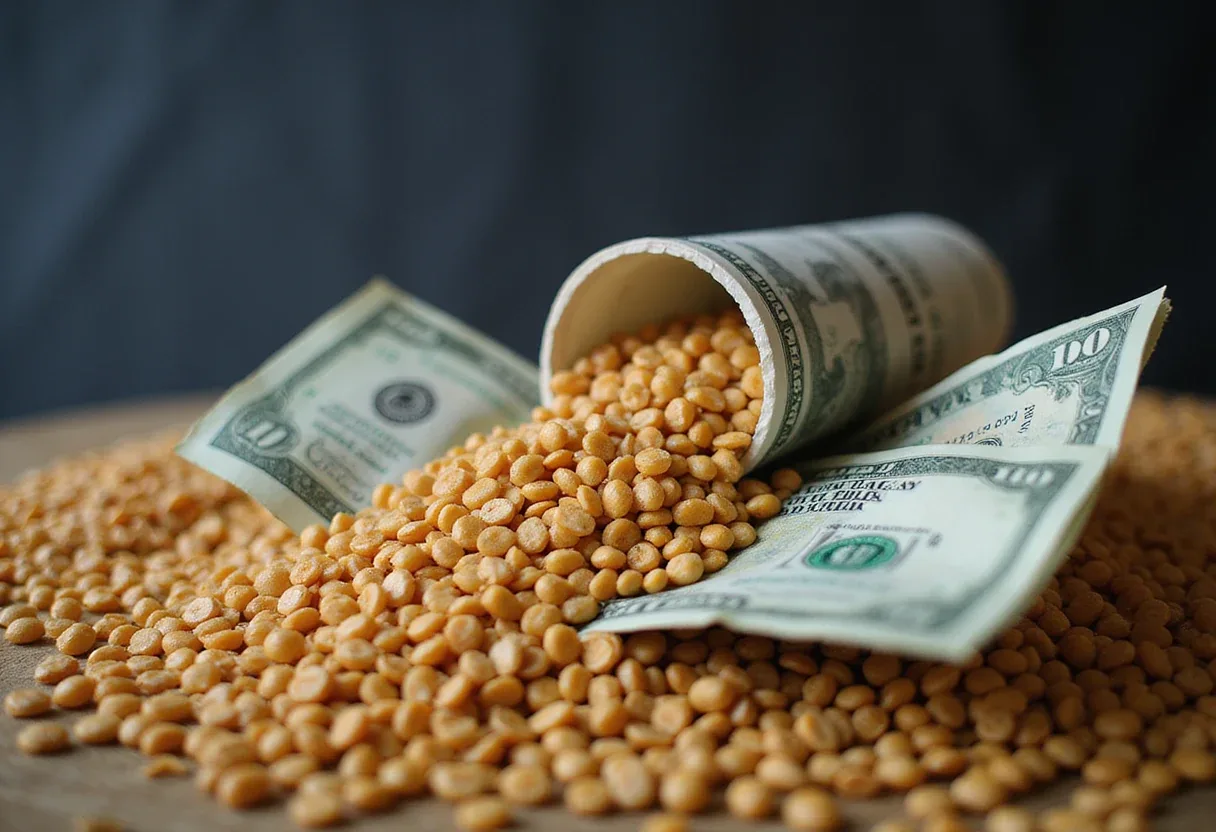
Soybeans returned the highest cash bid among major grains tracked by USDA in Week 40 of 2026, according to a market summary published by IndexBox this week. The data aggregator flagged soybeans at the top of the cash-bid table for the week ending in early October, though the underlying elevators, regions and dollar-per-bushel figures were not included in the headline-level release reviewed by Agribusiness Wire.
Week 40 in the USDA marketing calendar covers the first week of October, a period that typically overlaps with the early stages of harvest pressure across the Corn Belt. Cash bids — the prices elevators pay growers at delivery — generally slide as new-crop supplies hit the pipeline, and the relative ranking of bids shapes which crops growers move first off the combine and which they hold in on-farm storage. Read this ranking as a window into local logistics, not a national price ceiling.
What the IndexBox summary shows
The headline finding — soybeans above corn, wheat and other grains in cash-bid ranking — places oilseeds back at the front of the grower-economics queue for the week. IndexBox did not release the specific bid levels, the number of reporting elevators, or the geographic spread of the top-of-table pricing in the summary reviewed here. Reporting-window methodology questions — whether the USDA data reflects a national average, a benchmark region, or a state-level reading — likewise remain unanswered in the published note.
Hart's caveat: every quarterly cash-bid release deserves a check against USDA's AMS portal, which publishes elevator-by-elevator quotations and the daily volume behind each reading. A top-of-table ranking without basis context is half a story.
What USDA cash-bid data typically covers
USDA's cash grain prices, aggregated by the Agricultural Marketing Service (AMS), pull from a network of elevators across the country. Bids are reported at a point in time and reflect local supply, nearby processing demand, transportation costs, and basis adjustments to the futures market on the Chicago Board of Trade. Rankings shift fast when a single elevator posts a single high bid; check the count before celebrating a national read.
For the early-October window:
- New-crop corn typically enters the pipeline with elevated harvest pressure on bids
- Soybeans compete with export demand from Gulf and Pacific Northwest elevators
- Wheat bids are tied to protein premiums and rail logistics
Why the ranking matters to margins
Cash bids at the top of the table carry weight with growers planning fall sales. In a week where soybeans lead, a soybean-heavy operation may choose to deliver at harvest rather than store, while a corn-heavy operator weighs storage costs against a weaker spot bid. Cooperatives that forward-sold bean bushels against basis contracts face a different calculus, since their realized price is locked at the basis agreed earlier in the year. The same headline can mean profit or pressure depending on whether a grower is selling this week or holding until spring.
What the summary does not tell us
The IndexBox note does not specify the reporting window's closing date, the number of elevators in the sample, or whether the top-of-table figure reflects a single outlier bid or a weighted average. It also does not name the cooperative, terminal, or processor that posted the leading cash figure. Those details typically appear in the USDA AMS daily grain price report, which is published separately and is the data set analysts cross-check against index aggregators like IndexBox.
Hart's caution: index-aggregator summaries are useful as signposts, not as stand-alone inputs to a marketing decision. Pulling the underlying USDA AMS table and matching its date stamp is the next move.
What to watch next
Week 41 of 2026, which closes mid-October, brings the next USDA cash-bid update. Harvest progress reports from USDA NASS land at the same time and tell readers whether bean harvest has crossed the halfway mark. The interaction between USDA's harvest pace estimate and the AMS cash-bid ranking will give a clearer read on whether the soybean-premium finding in Week 40 is a one-week anomaly or a trend that runs into November. Week 41 is the next real test, not the next headline.
via Google News: Grain prices (Source)
More from Olivia Hart
Show full bio
News editor covering technology and product news in Agribusiness coverage for industry professionals at Agribusiness Wire.
419 articles